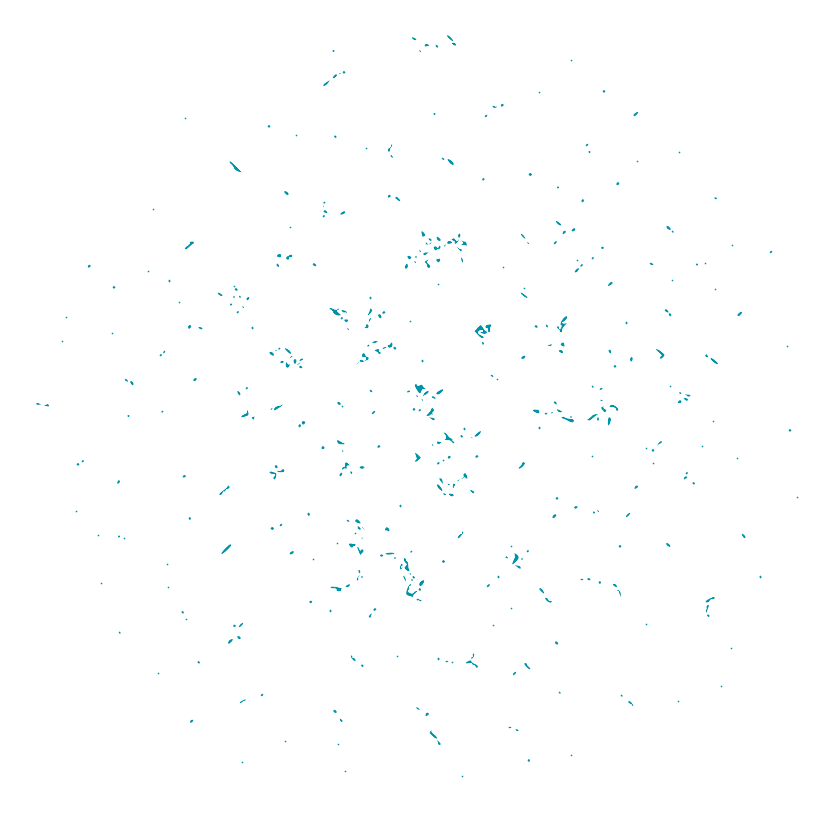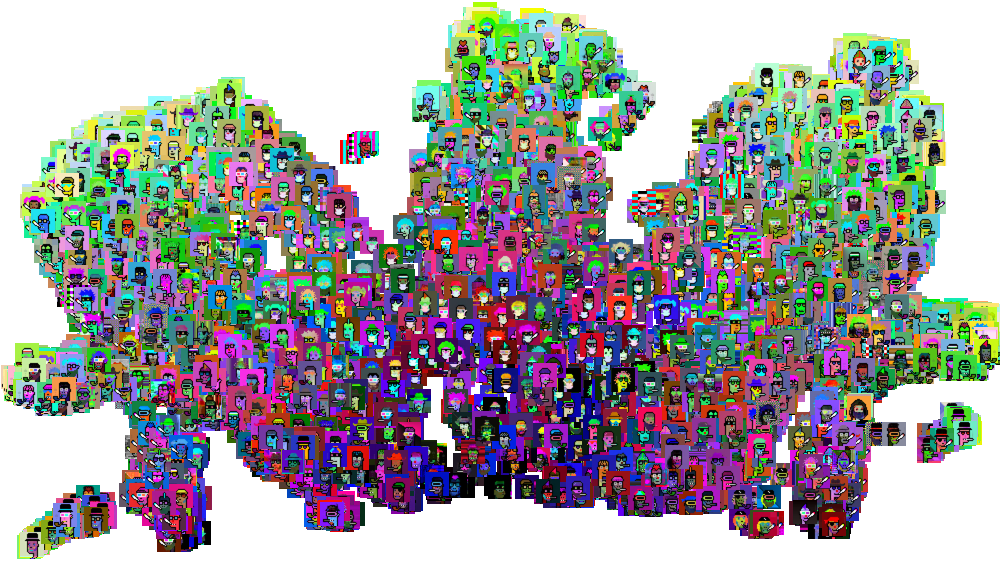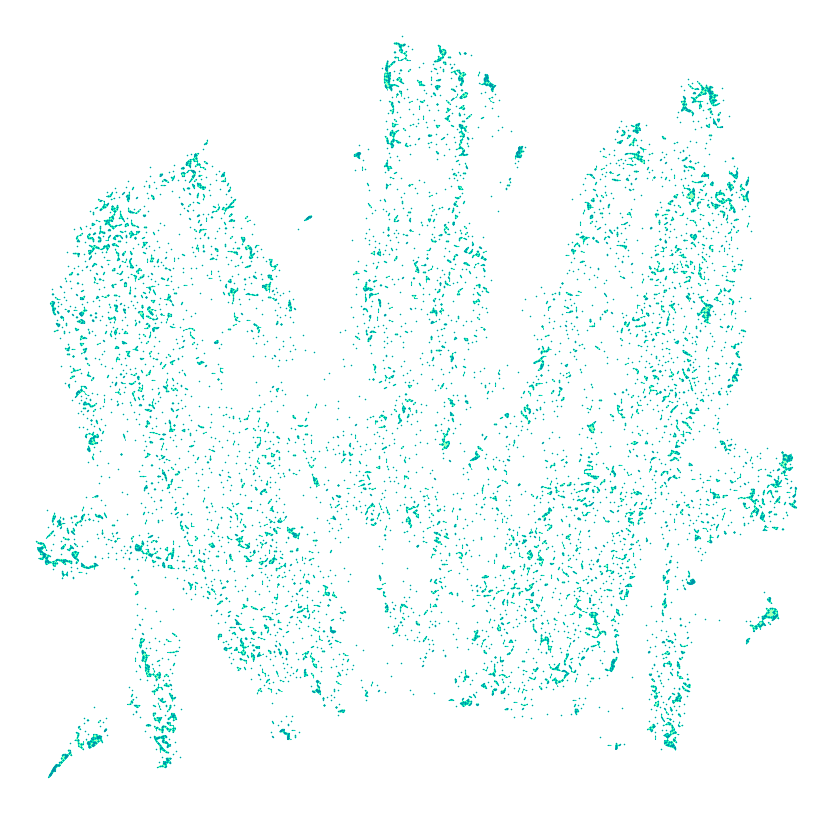
Hypermaps are "smart scatter plots" of entire NFT collections. Each NFT is plotted as embedded by various ML techniques. The tools we are building use a variety of algorithms, each of which teases the data apart in unique ways. In the end, hypermapping always results in a smart scatter plot, and hopefully the maths do some good "clustering" for us humans.
The term "hypermap" was made up here at Many Hands. The name "hypermaps" was chosen for this technology because no one specific algorithm covers the whole topic. More complex hypermaps are the output of data pipelines involving multiple algorithms chained together: clustering, dimensionality reduction, neighborhood embedding, etc.
As a demonstration of hypermaps, the following are some smart plots of the CryptoPunks NFT collection.
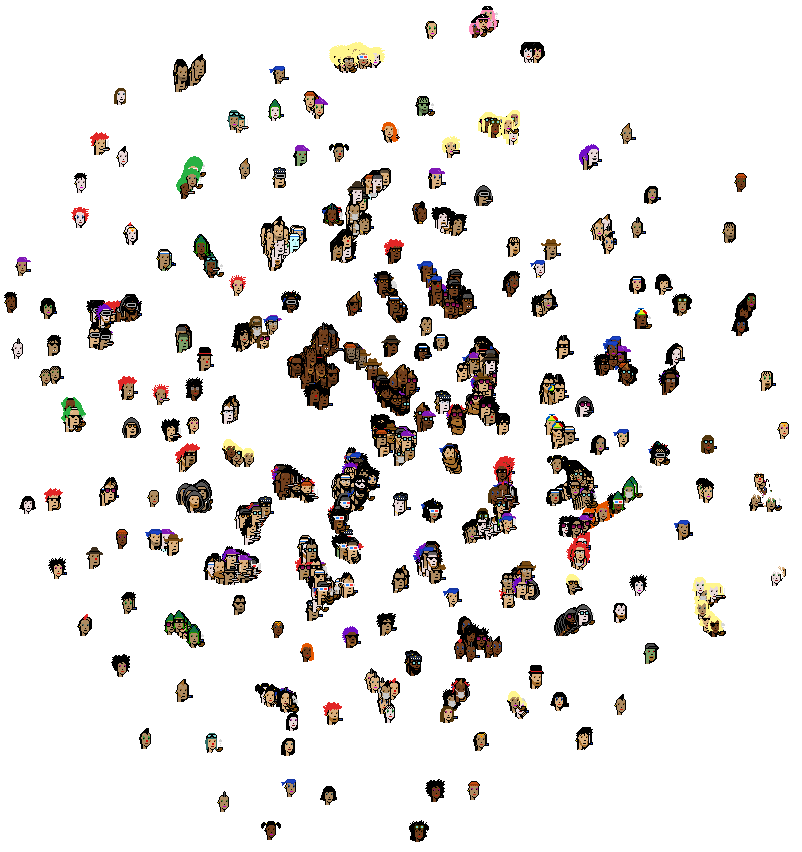
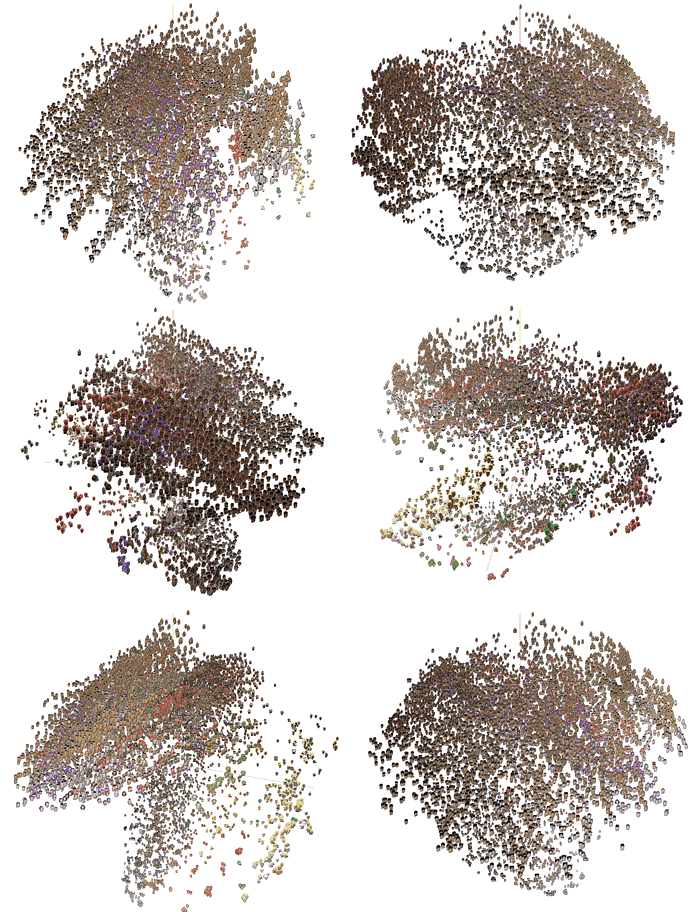
The following is a very early plot. It proved sufficiently that there was indeed structure in the images that these dimensionality reduction techniques can detect to good effect.
